
Dashboards & Reports
Everything for a process,
in one view.
Bring every metric, trend, and reading for a process onto one live screen, so the full decision-making context sits in one place.
Dashboard views
Start from a standard set, then make it yours
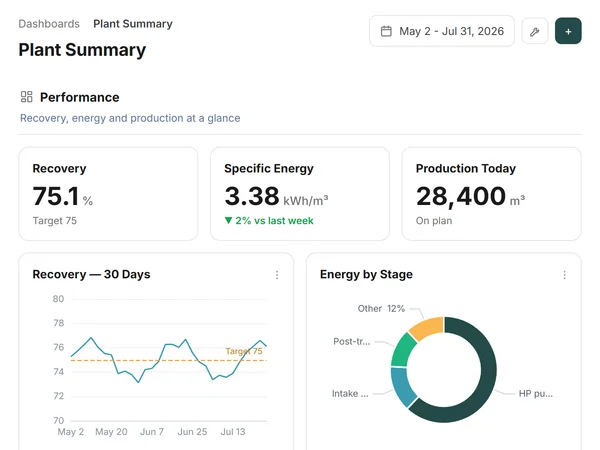
Pani dashboards tie together the different threads of information you need to get immediately up to speed on a process, so you're looking at the entire situation instead of hunting for the parts of it.
Pre-configured & purpose-built
Summary, performance, operations and maintenance, configured for your process, so everyone is working from the same picture.
Your own dashboard, as your home screen
Operators build their own, name it, and mark it a favourite so it opens first. At a large plant where you own one part of the process, that's the screen you live in.
Organised as it grows
Titled dividers between groups of blocks, and dashboard views nested under one another, so a plant running forty of them stays navigable.
Visualizations
Each block is best at a different job
Pani gives you a full suite of visualizations you can mix and match to ensure all the right information, in the right format, is available in a single view.
The dashboard your next shift opens
Start Your Day with Pani
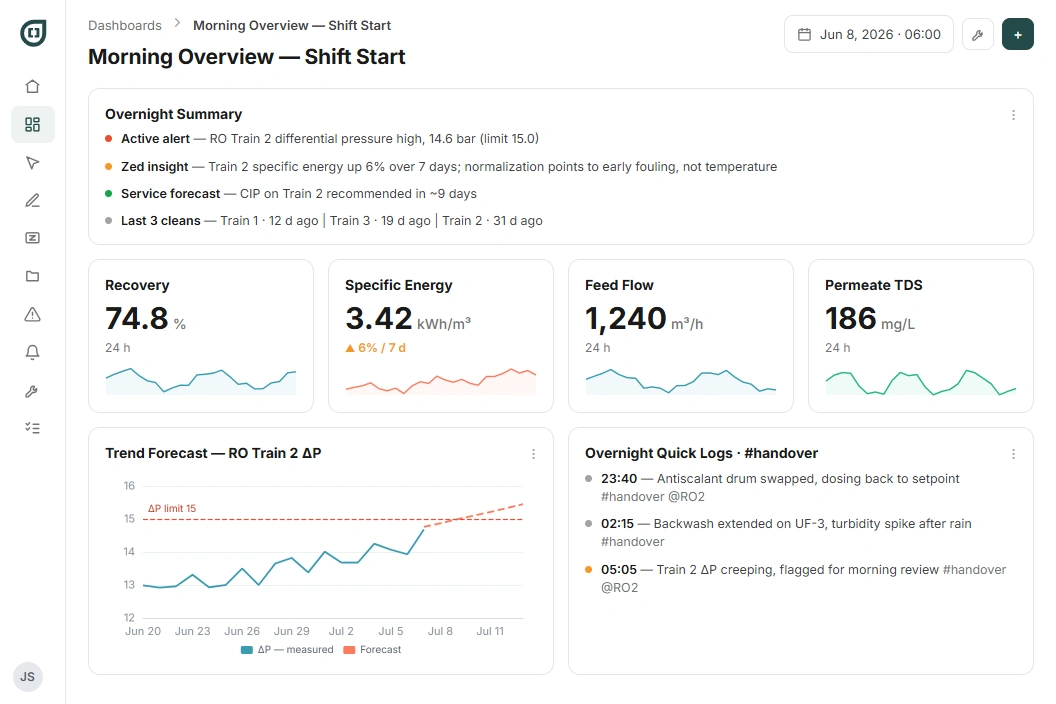
An operator walking in at 6 a.m. needs four things: what's alarming, whether the plant is in normal range, what happened overnight, and what's heading somewhere bad.
What's alarming
A summary block consolidates the active alerts, Zed's insights, service forecasts and the last three cleans.
Is the plant in normal range
Four to six KPI blocks show the current value and a 24-hour sparkline, because the number alone doesn't tell you whether it's climbing.
What happened overnight
The quick logs your team tagged #handover, the same notes that show up on the Explore chart.
What's heading somewhere bad
A trend forecast block, before the value is out of range.
Calculated Metrics
Turn raw readings into a number you can act on
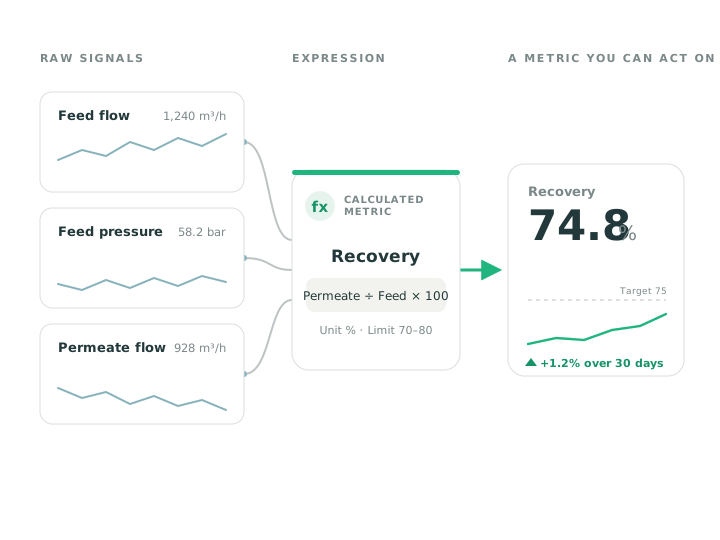
A raw sensor reading often isn't the number the decision turns on. Recovery, specific energy, normalized flow, cost per day: each is built from instruments you already have, and once it exists it behaves like any other signal on the platform. Pani fills in its whole back history when you save it, so a new metric arrives with its past already there.
Measure what has no sensor
Pump power from flow and pressure where there's no power meter. Daily volume off a cumulative totalizer. A pH average that ignores the CIP rinse. Numbers your instruments were never going to report on their own.
Put it in money
Chemical consumption becomes chemical cost at your price. Energy becomes energy cost at your tariff. A trend in cost per day is one anyone in the building can act on.
Build on what you've built
A metric can take other metrics as its inputs, so a handful of raw signals rolls up into a single composite score.
Current, and available everywhere
It recalculates on its own, unlike a spreadsheet somebody has to remember to re-run. Then it's there on any dashboard, as an alert trigger, and to Agent Zed in answers and scheduled jobs.
The standard library
Pani builds these for your plant
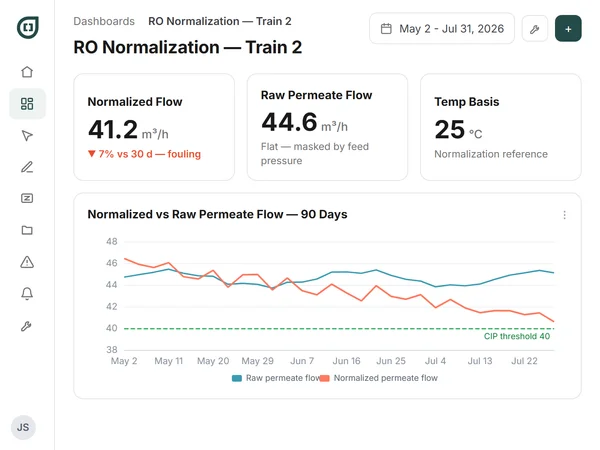
You don't have to invent these. The calculations that matter in water treatment are well established, and Pani builds them for your plant during implementation. Your raw readings arrive already turned into the numbers a decision rests on: how much water you're actually recovering, what it's costing in energy, and whether the membranes are genuinely fouling or the temperature just moved.
- RO normalization
- Specific energy consumption
- Recovery
- Salt passage
- Pump efficiency
- Cleaning effectiveness
- Membrane tracking
Reports
Schedule a dashboard to the people who need it
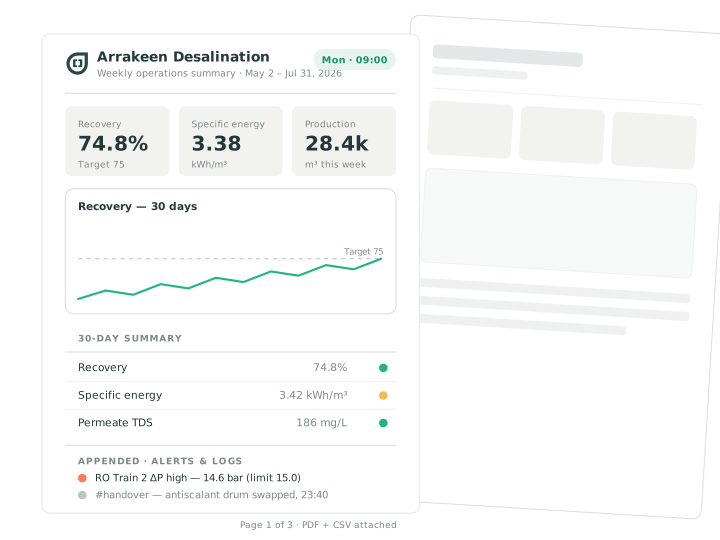
Not everyone who needs these numbers is going to open Pani. Build a dashboard around what one audience actually cares about, weekly operations for the plant team, a monthly summary for leadership, and schedule it to them. The formatting holds, active alerts and quick logs come appended, and there's a Send Now button for when someone asks out of cycle. It replaces the hours somebody currently spends rebuilding the same pack every month.
"So I have to build all this myself?"
No. Most of it already exists.
You're starting from what worked at plants like yours, and adjusting.
The dashboards already exist
Pani has spent years building these for water treatment plants, and the ones that matter for your process are already known.
Your team configures them
Your implementation team sets them up for your plant, not you from a blank canvas.
Metrics switch themselves on
Each standard metric activates as soon as the sensors it needs start reporting.
Pani Enterprise
Interested in Dashboards & Reports?
Dashboards and Calculated Metrics are Pani Enterprise.
Compare plansRelated capabilities
Works with the rest of Enterprise
See it on your plant's data
We'll show you the dashboards a plant like yours runs, on your own data.