
For drinking water utilities
Meet demand and stay in compliance,
with operations intelligence across your plant.
Pani reads the operating data and lab results you already have, and flags a compliance risk while there's still time to act.
Maintain
compliance
Zed tracks your compliance margin every day between samples, so a drift toward a limit is caught while you can still act.
Cut
chemical cost
Zed watches coagulant and disinfectant dosing against real source-water conditions and flags where you're overdosing.
Extend
asset life
Zed tracks the real condition of filters, membranes, and pumps so each is replaced when it needs it, not early or late.
Agent Zed
Your process analyst that never sleeps
Agent Zed is like your very own drinking water expert that holds in its mind the entirety of your plant's data, operating history, and process control narrative. It can analyze, report, and advise around the clock.
Ask Zed
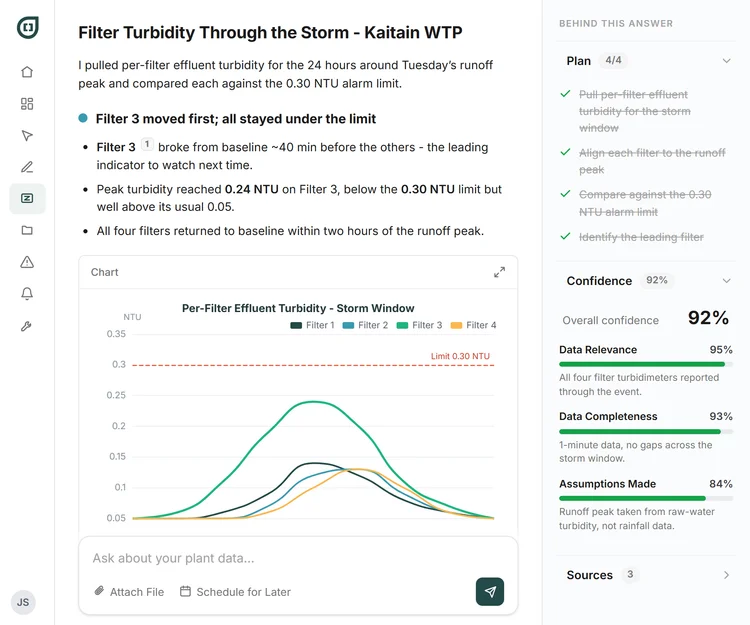
Ask Zed lets you put any question or analysis to Agent Zed and get an answer grounded in your own plant's data and history. For a drinking water utility, that's a fast read on a filter-breakthrough event you can't explain, or a way to walk a new operator through your plant's specific SCADA quirks.
Zed Jobs
Zed Jobs are recurring analyses you set up once and let Agent Zed run autonomously, on the schedule you choose. Here that means a daily CT and residual compliance check, a running chemical days-to-empty forecast, and your monthly regulatory filing pack assembled automatically.
Just some of what Zed can do at a drinking water plant
Zed can perform hundreds of jobs across the plant. Select from pre-built jobs or build your own for Zed!
Compliance
CT compliance margin monitor
Tracks your CT disinfection margin against the regulatory minimum every day, so a shrinking margin shows up before a sample does.
Coagulation
Alum dose advisory
Recommends coagulant dose against real source-water conditions, instead of a fixed recipe adjusted by feel.
Storm response
Storm coagulation response
When raw turbidity steps up with runoff, advises the coagulation adjustment to hold treated-water quality.
Filtration
Filter breakthrough early warning
Watches each filter for the early signs of breakthrough and ripening, so a problem is caught at the filter, not in the combined number.
Membranes
UF per-cell integrity monitor
Tracks per-cell membrane integrity from decay-rate data, so a failing cell is flagged before it reaches finished water.
Membranes
Membrane replacement forecast
Forecasts membrane replacement timing off the actual trend, so capital is spent when the asset needs it.
Membranes
Membrane CIP recommendation
Recommends which cell needs cleaning and when, so a CIP is timed to condition rather than routine.
Compliance
TTHM precursor monitor
Watches the precursor levers behind THM formation, so you can act on the cause before the regulated number climbs.
Compliance
PFAS detection tracker
Tracks PFAS detections against UCMR5 reporting, so compliance status stays current between required samples.
Distribution
Distribution nitrification risk
Forecasts nitrification risk in the distribution system from chlorine and pH stability, so you can act before a zone turns.
Wells / energy
Well dispatch advisory
Ranks wells by specific energy so you dispatch the most efficient sources first and cut pumping cost.
Chemicals
Chemical days-to-empty
Forecasts how many days of chemical stock you have left, so a reorder happens on schedule instead of as an emergency.
…and many others.
What Zed found at one plant
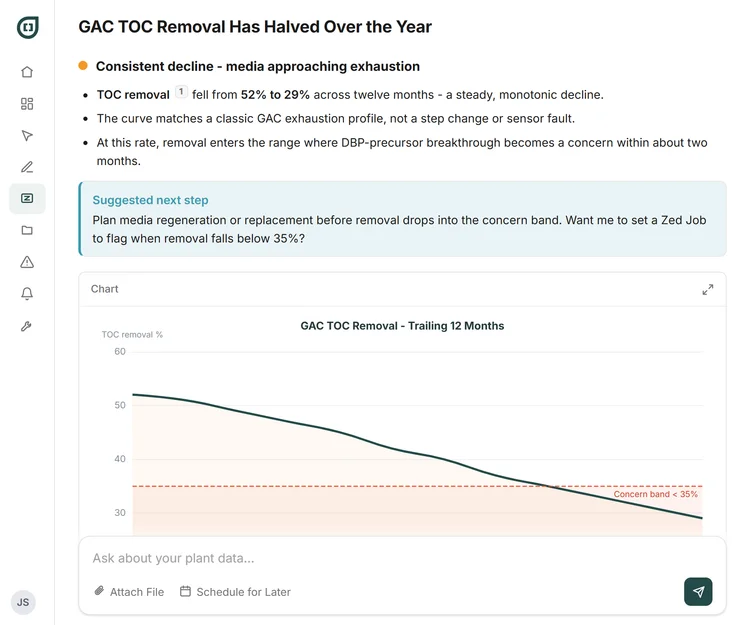
TOC removal at one plant slid from around 52% to 28 to 30% over several months. Treated water looked steady the entire time. Nothing tripped an alarm. One month came within a hair of the regulatory disinfection byproduct floor before anyone noticed the trend.
Zed caught it by watching the removal rate itself, not just the treated-water result it was protecting. The plant was in compliance and looked healthy. Only the trend revealed the risk.
Data Explore
Trace it back to the cause
Explore lets you investigate any change or anomaly in your plant and follow it through every connected signal to the root cause. A filter breakthrough, for instance, rarely starts with the storm everyone remembers: Explore traced one back to a coagulation-efficiency dip that set in days before the runoff event.
Learn more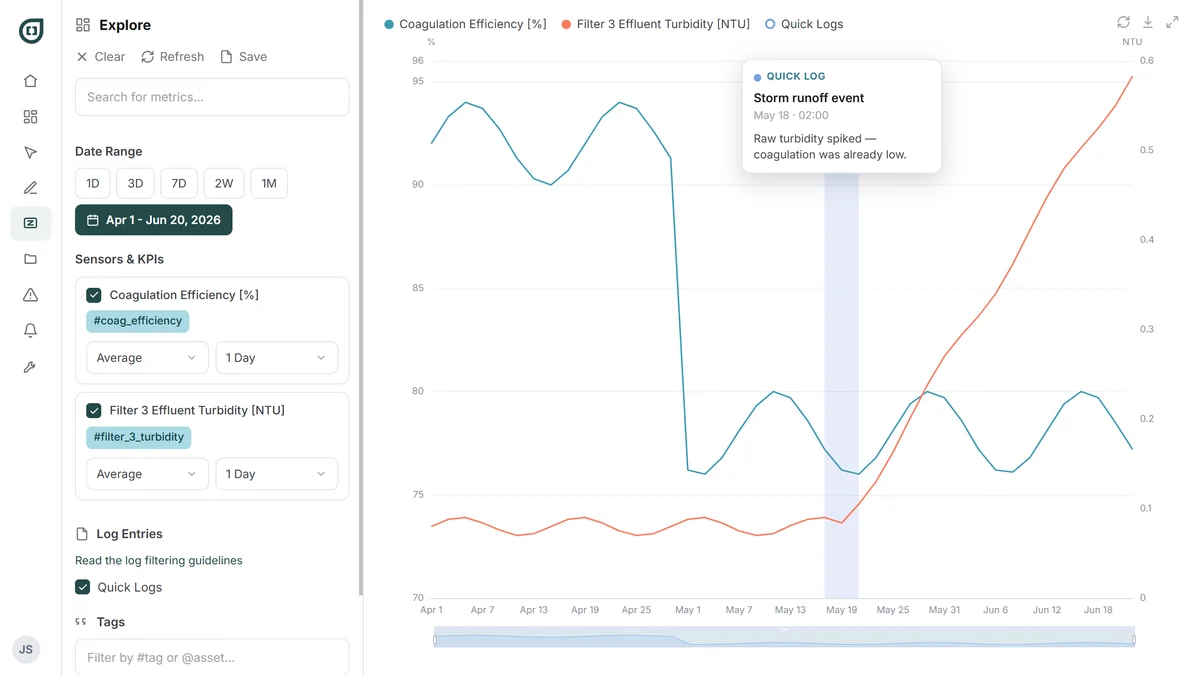
Advanced features & use cases
Dashboards & Reports
See the whole picture on one screen
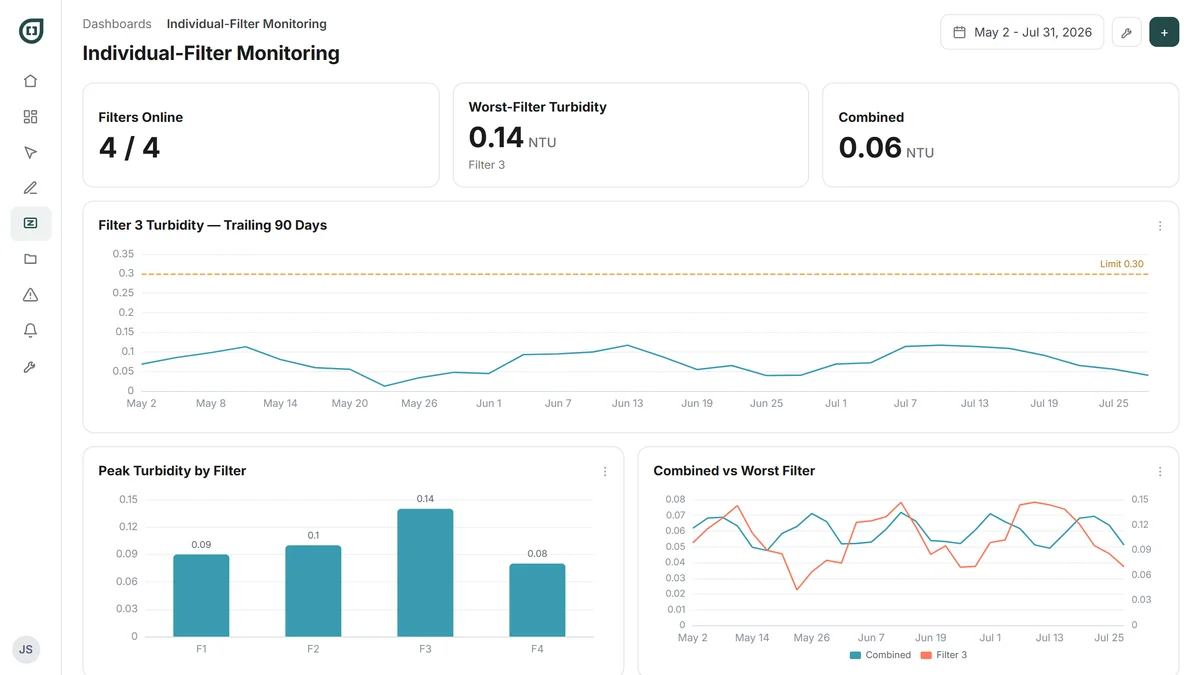
Dashboards bring every metric that matters into one live view, and reports package the summary for whoever needs it.
Alerts & Notifications
Go beyond basic alarms. Define alerts based on your own KPIs.
Pani watches your plant's signals around the clock and notifies the right person the moment something needs attention.
Chlorination-regime alerting
At one plant, free chlorine stepped up sharply and held there for months, an undocumented change nobody had written down anywhere. Zed watches the ratio of free to total chlorine continuously and flags a shift like that before it becomes a mystery six months later.
DBP/PFAS trend alerting
Regulatory limits for disinfection byproducts and PFAS are checked on a fixed schedule. Zed tracks the underlying trend between those checks, so a slow climb toward the limit doesn't go unnoticed until the next required sample.
Chemical days-to-empty alerts
A running forecast of how long your current chemical stock will last, so a reorder happens on your schedule, not as an emergency.
- Chlorine-ratio shiftFree / total chlorineRatio shift > 15%+18%7m
- DBP trend to limitTTHM running trendProjected > 80 µg/L22 d1d
- Hypochlorite days-to-emptyDay-tank forecast< 7 days6 dack
- Filter turbidityFilter 3 effluent> 0.3 NTU for 15 min0.2825m
- Distribution residualEntry-point chlorineWithin band1.1—
Chlorination regime shifted
Free / total ratio · +18%
Confirm the dosing change was intended and log it before shift end.
Tasks & Procedures
Combine tasks with the right context to action them
Pani turns recurring work into assigned tasks with the right procedure attached, so the same job gets done the same way every time.
Set up the work that repeats. Daily rounds, filter checks, calibration schedules. Pani creates each one on the schedule you set, assigned, with a due date and the right asset linked.
Attach your storm-event coagulation-adjustment procedure and it travels with the task. The operator sees the steps in Pani, not in a binder they have to find first.
- Filter 2 backwash verificationFilter 2To Do
- CT compliance logContact BasinDone
- Chlorine analyzer calibrationCl₂ Analyzer 1In Progress
- Coagulant pump checkCoag SkidTo Do
- Effluent turbidity lab entryFilter LabDone
- Fluoride dosing checkFluoride SkidTo Do
Filter 2 backwash verification
Kaitain WTP · Filtration
AssetConfirm backwash duration; turbidity < 0.10 NTU on return.
Fri, Aug 1
Want to go deeper?
Custom dashboards, trend-forecast alerts, calculated metrics your instruments don't report, and your procedures embedded in the work. Built for utilities managing compliance across one plant or a whole distribution system.
Put operations intelligence to work across treatment and distribution
Upload the data you already have and Zed builds a complete picture of your plant, and the opportunities in it, within hours.