For food and beverage manufacturers
Get more from every liter,
with operations intelligence across every line.
Pani finds where water and money are being lost across your lines, so you can make the same product with less.
Improve your
water ratio
Zed breaks your water usage ratio down to the line and the shift, so the number becomes something you can actually fix.
Cut
water cost
Zed finds the water you're losing, and paying for twice, before it disappears into next quarter as unexplained variance.
Meet
ESG targets
Zed shows the why behind a water-ratio improvement, the specific finding driving it, not just a trend line.
Agent Zed
Your process analyst that never sleeps
Agent Zed is like your very own food and beverage expert that holds in its mind the entirety of your plant's data, operating history, and process control narrative. It can analyze, report, and advise around the clock.
Ask Zed
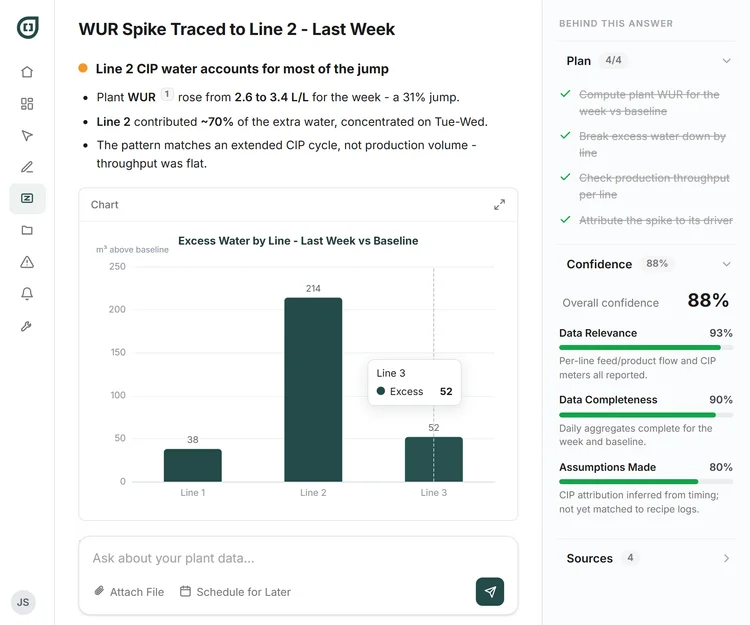
Ask Zed lets you put any question or analysis to Agent Zed and get an answer grounded in your own plant's data and history. For a beverage plant, that's a fast explanation for a WUR spike, or the case-building numbers you need for a sustainability report or a capital request.
Zed Jobs
Zed Jobs are recurring analyses you set up once and let Agent Zed run autonomously, on the schedule you choose. Here that means the water mass-balance and WUR job run on your own fiscal calendar, so the numbers land where finance already looks.
Just some of what Zed can do at a beverage plant
Zed can perform hundreds of jobs across the plant. Select from pre-built jobs or build your own for Zed!
Water balance
WUR & water balance analysis
Breaks your water usage ratio down by mass balance, so the number becomes something you can act on line by line.
Diagnostics
Per-line loss attribution
Attributes water loss to a specific line and shift, so a fix targets the source instead of the whole plant.
Losses
Leak & overflow detector
Flags leaks and overflows from the water balance, so losses are caught while they're small.
RO
RO trains performance
Reports RO train performance so you can see where recovery and efficiency are drifting.
Water quality
Salt-rejection anomaly detector
Watches salt rejection for anomalies, so a product-water quality risk is caught before a batch is affected.
Process
Throughput anomaly detector
Watches process hydraulics and throughput for anomalies that signal a developing problem.
Diagnostics
Reject-to-feed gap analysis
Analyzes the gap between one train's reject and another's feed, surfacing recovery left on the table.
Reporting
Shift RO quality report
Assembles an RO water-quality report each shift, so the numbers are ready where operations already look.
CIP
CIP effectiveness monitor
Tracks clean-in-place effectiveness by line, so a weak cycle is caught before it costs water or quality.
CIP
CIP cycle optimizer
Recommends CIP cycle and chemical adjustments to hold cleaning quality while cutting water and chemical use.
Water quality
Product-water spec monitor
Watches product water against your spec, so a slow drift shows up before it reaches the line.
Utilities
Utilities water-use analysis
Breaks down cooling and utilities water use, so loss outside the process line is visible too.
…and many others.
What Zed found at one plant
A beverage bottling plant improved its water usage ratio by roughly 20% in five months. UFRO recovery nearly tripled. Recovery-RO efficiency rose from 61.6% to 71%. Monthly water loss dropped 96%.
None of it required new equipment. The constraint wasn't capital, it was visibility into which line, which hour, which valve was driving the loss. Once that was visible, the fix was operational, not a purchase order.
Data Explore
Trace it back to the cause
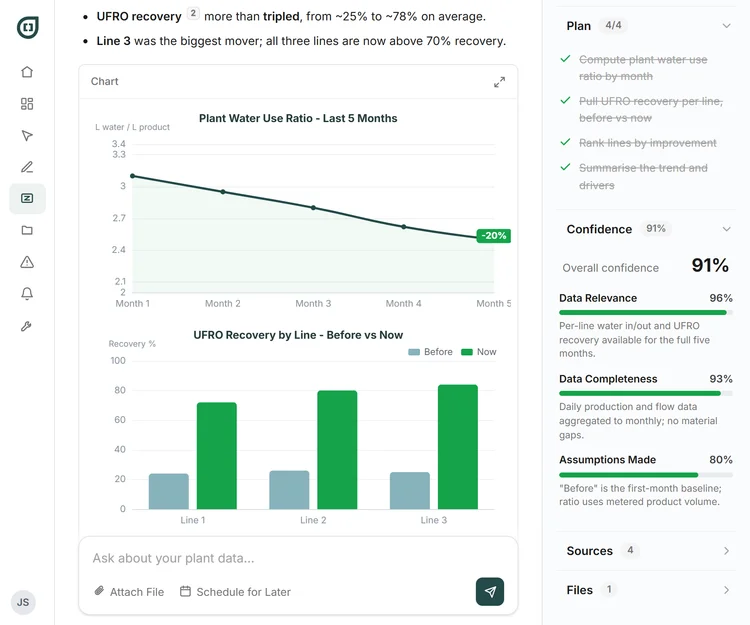
Explore lets you investigate any change or anomaly in your plant and follow it through every connected signal to the root cause. A plant-level WUR anomaly, for instance, doesn't tell you where to look: Explore traces it to the specific production line and shift driving the loss, so a fix targets the source.
Learn more
Advanced features & use cases
Dashboards & Reports
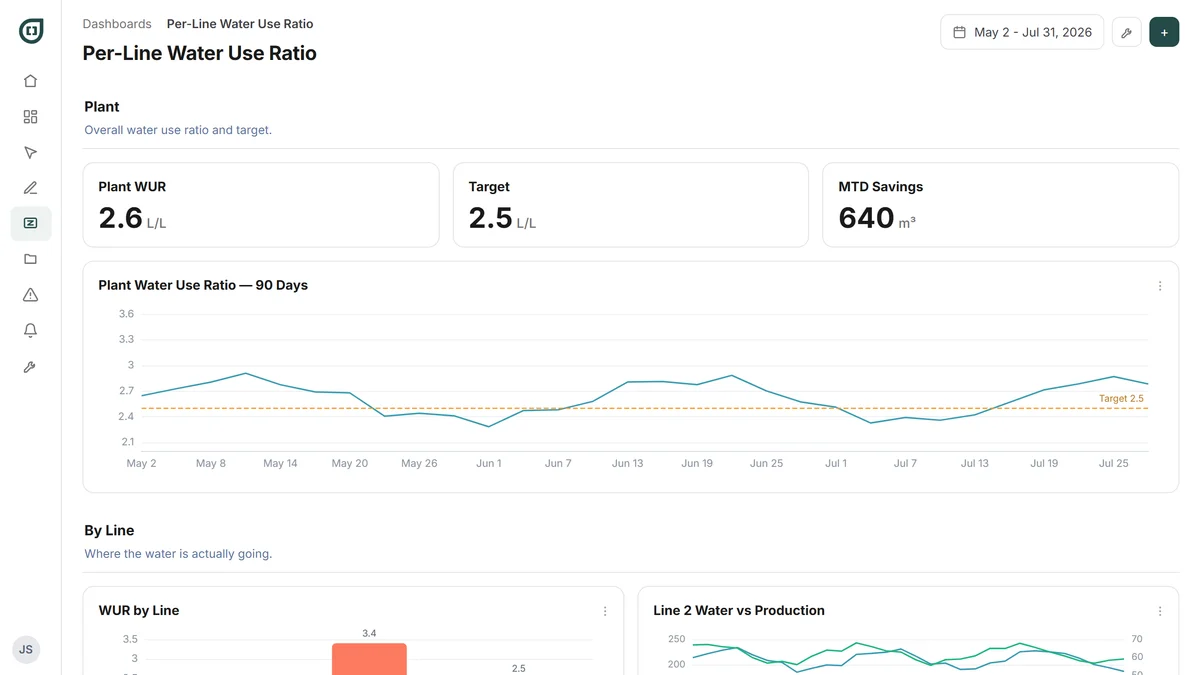
See the whole picture on one screen
Dashboards bring every metric that matters into one live view, and reports package the summary for whoever needs it.
Alerts & Notifications
Go beyond basic alarms. Define alerts based on your own KPIs.
Pani watches your plant's signals around the clock and notifies the right person the moment something needs attention.
Product-water quality alerts
Salt rejection and RO performance, watched continuously against your actual product spec, so a quality risk is caught before a batch is affected, not after.
CIP-effectiveness alerts
A CIP-effectiveness dip on a specific line triggers an alert before it becomes a quality problem downstream.
- Product-water qualityRO permeate conductivity> 15 µS/cm for 10 min184m
- CIP effectiveness dipLine 2 CIP delta< 85% effectiveness82%40m
- Salt rejectionRO salt rejection< 98.5%98.3%ack
- Antiscalant days-to-emptyDosing tank forecast< 5 days4 d1h
- UV doseUV reactor outputWithin bandNormal—
Product-water quality risk
RO permeate · 18 µS/cm
Hold the line and verify against product spec before filling.
Tasks & Procedures
Combine tasks with the right context to action them
Pani turns recurring work into assigned tasks with the right procedure attached, so the same job gets done the same way every time.
CIP verification, line checks, calibration routines. Set the schedule once and Pani creates each task automatically, assigned and linked to the line it covers.
Attach the procedure and the steps travel with the task, so a CIP is run the same way on every line, on every shift, by every operator.
- Line 2 CIP verificationCIP SkidTo Do
- UV disinfection logUV Unit 1Done
- RO membrane flushRO Skid AIn Progress
- Softener regeneration checkSoftener 1To Do
- Product conductivity logBottling LineDone
- Carbon filter changeCarbon FilterTo Do
Line 2 CIP verification
Giedi Beverages · Process water
AssetVerify caustic/acid strength; final rinse < 250 µS/cm.
Fri, Aug 1
Want to go deeper?
Custom dashboards, trend-forecast alerts, calculated metrics your instruments don't report, and your procedures embedded in the work. Built for bottling networks and multi-site operations working under one sustainability mandate.
Put operations intelligence to work across every production line
Upload the data you already have and Zed builds a complete picture of your plant, and the opportunities in it, within hours.