For desalination plants
Cut your cost per cubic meter,
with operations intelligence across every train.
Pani reads your plant's data every day and finds where cost and performance are drifting, before it shows up on the bill.
Cut cost
per m³
Zed weighs each decision's cost in energy, chemicals, and membrane wear against your data to find the cheapest way to run.
Protect
uptime
Zed watches every signal for the early signatures of failure and tells you what to do while there's still time to plan the fix.
Extend
membrane life
Zed tracks each asset's real condition over time so cleaning and replacement happen on the evidence, not a fixed calendar.
Agent Zed
Your process analyst that never sleeps
Agent Zed is like your very own desalination expert that holds in its mind the entirety of your plant's data, operating history, and process control narrative. It can analyze, report, and advise around the clock.
Ask Zed
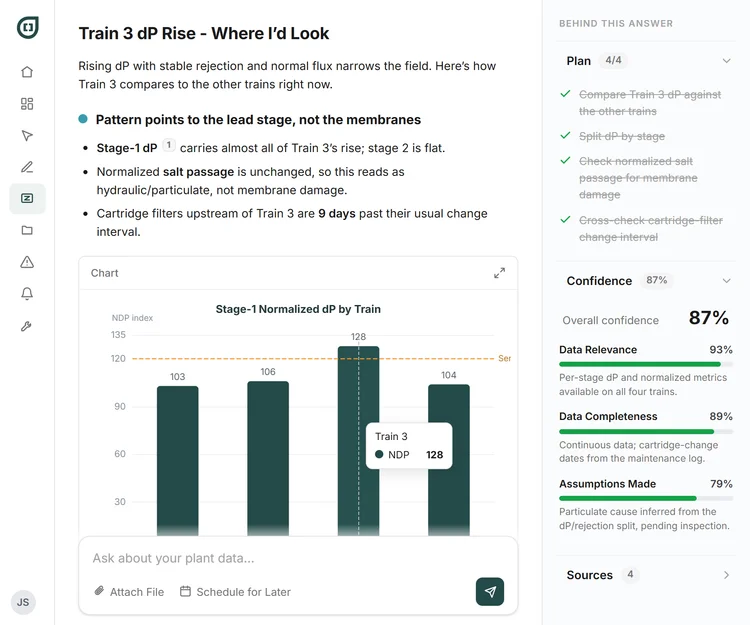
Ask Zed lets you put any question or analysis to Agent Zed and get an answer grounded in your own plant's data and history. For desalination, that's a second opinion when your RO engineers hit something unusual, and a fast way to bring a junior operator up to speed on how your trains actually behave, not a generic RO textbook.
Zed Jobs
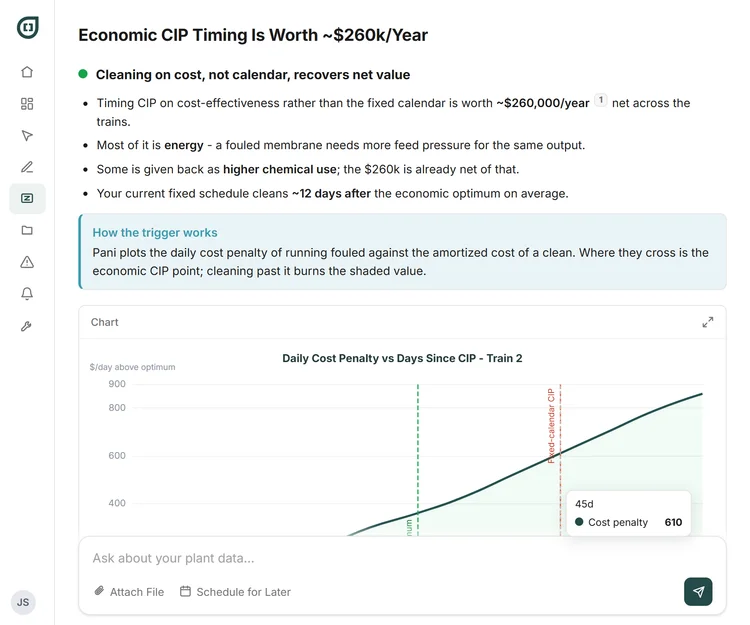
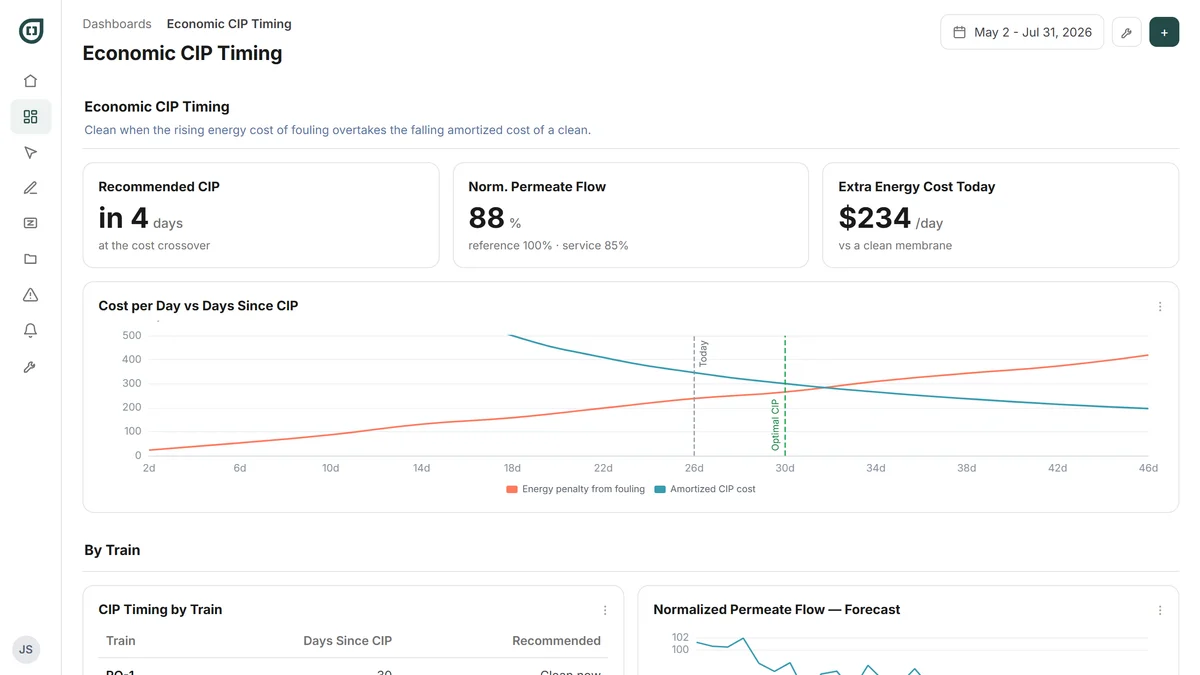
Zed Jobs are recurring analyses you set up once and let Agent Zed run autonomously, on the schedule you choose. At a desal plant, that means economic CIP timing that cleans on cost-effectiveness rather than the calendar, plus a constant watch for RO fault signatures 5 to 7 days before they'd otherwise show up.
Just some of what Zed can do at a desalination plant
Zed can perform hundreds of jobs across the plant. Select from pre-built jobs or build your own for Zed!
CIP
CIP timing recommendation
Recommends the cleaning date that pays for itself, weighing energy saved against chemical spent.
Fouling
Biofouling watchdog
Watches for the onset of biofouling, so it's caught while a clean can still reverse it.
Fouling
Stage-1 fouling early warning
Watches first-stage differential pressure for the fouling signature, ahead of a performance hit.
Scaling
Stage-2 scaling early warning
Watches second-stage signals for early scaling, so you can adjust before it costs recovery.
Pretreatment
MF integrity monitor
Tracks microfiltration membrane resistance and integrity, so a pretreatment problem is caught before it reaches the RO.
Water quality
Salt rejection analysis
Reviews salt rejection across the plant, surfacing a developing membrane problem in the trend.
Anomaly
SWRO/BWRO anomaly detector
Watches seawater and brackish RO for anomalies that signal a developing fault.
Anomaly
Per-pass anomaly detector
Watches each RO pass separately, so a second-pass problem isn't hidden in the blended number.
Membranes
Membrane replacement forecast
Forecasts replacement timing off actual condition and ROI, not a fixed interval.
Pumps
HP pump performance analysis
Tracks high-pressure pump performance, so a developing issue shows up as a trend before downtime.
Recovery
Recovery vs scaling optimizer
Shows how far you can push recovery before scaling risk rises, as a live trade-off.
Consumables
Consumables forecast
Forecasts consumable use so reorders happen on schedule, not as a scramble.
…and many others.
What Zed found at one plant
One operation cleaned on a fixed calendar rather than an economic trigger. Zed's analysis found roughly $260,000 a year in net value available. Most of that is energy. Some of it goes back out in higher chemical use.
Data Explore
Trace it back to the cause
Explore lets you investigate any change or anomaly in your plant and follow it through every connected signal to the root cause. At one power-station desalination facility, cleaning frequency jumped sixfold across the plant. Explore traced it through a damaged pretreatment seal into a shared filtrate tank connecting all five trains, the single point of failure driving a plant-wide problem that looked, at first, like five separate ones.
Learn more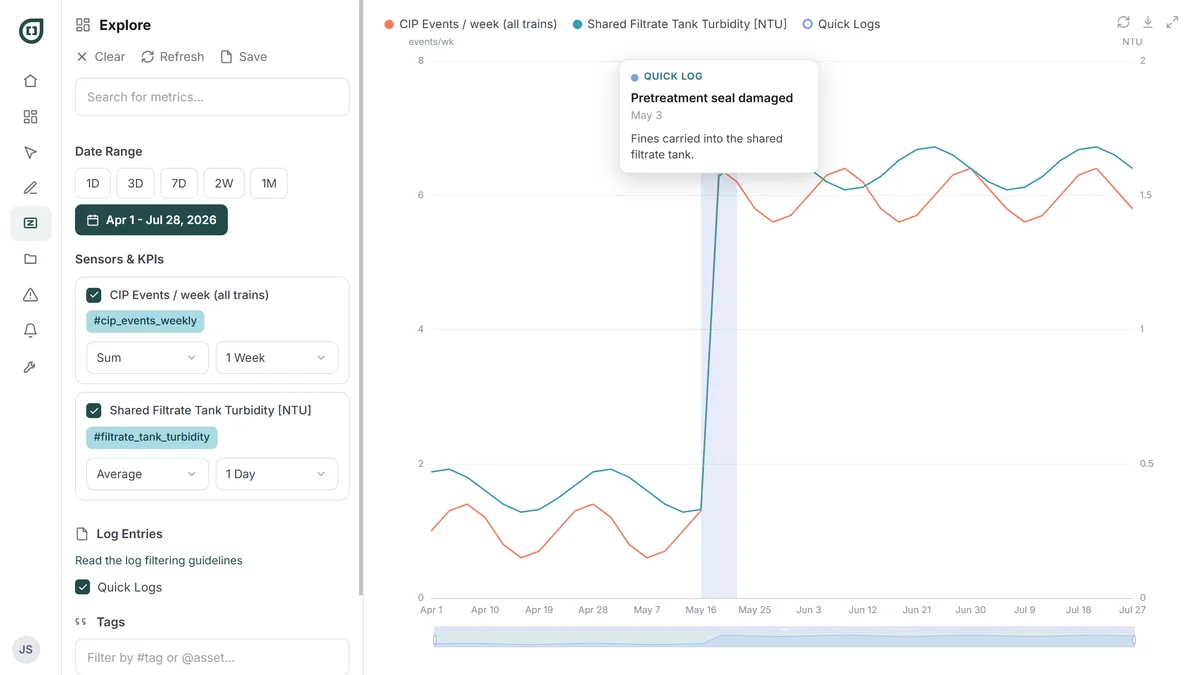
Advanced features & use cases
Dashboards & Reports
See the whole picture on one screen
Dashboards bring every metric that matters into one live view, and reports package the summary for whoever needs it.
Alerts & Notifications
Go beyond basic alarms. Define alerts based on your own KPIs.
Pani watches your plant's signals around the clock and notifies the right person the moment something needs attention.
RO fault early warning
A 5 to 7 day heads-up on developing RO faults, pressure, recovery, salt passage and energy watched together, so there's time to plan the response instead of reacting to it.
Membrane-replacement alerts
A 90-day alert tied to actual trend, not a fixed calendar, so replacement timing is a cost decision, not a guess.
- RO salt passageTrain A salt passage> 1.8% for 30 min2.1%6m
- Membrane replacement dueTrain B normalized flowTrend → 90-day limit88 d1d
- Specific energy highSystem kWh/m³> 3.8 kWh/m³3.9ack
- Feed pressureHP pump discharge> 62 bar60.420m
- System recoveryOverall recoveryWithin band45%—
RO salt passage rising
Train A salt passage · 2.1%
Check for a leaking seal or o-ring before recovery is affected.
Tasks & Procedures
Combine tasks with the right context to action them
Pani turns recurring work into assigned tasks with the right procedure attached, so the same job gets done the same way every time.
For desalination, your CIP is one of those recurring tasks, and the dashboard tells the crew exactly when to run it.
Pani tracks cleaning effectiveness after every CIP, which is how you learn which procedure actually works best for your membranes and your fouling pattern, rather than repeating a recipe because it's what's always been done.
- RO Train 2 CIPRO Train 2To Do
- HP pump #2 vibration checkHP Pump 2Done
- Antiscalant drum swapDosing SkidIn Progress
- Cartridge filter changeRO Train 2To Do
- Feed SDI testIntakeDone
- Energy recovery device checkERDTo Do
RO Train 2 CIP
Arrakeen Desalination · Reverse osmosis
AssetLow-pH then high-pH clean; confirm flow recovery.
Fri, Aug 1
Want to go deeper?
Custom dashboards, trend-forecast alerts, calculated metrics your instruments don't report, and your procedures embedded in the work. Built for operators optimizing cost and uptime across one train or a whole fleet.
Case studies
Recovery and energy moved together instead of trading off: 12% more water recovered on 6% less energy.
Membrane life extended an estimated 20% by cleaning at the right moment instead of on a fixed schedule.
Read the storyRoughly $260,000 a year in net value, after the added chemical cost.
Read the storyPut operations intelligence to work across every train
Upload the data you already have and Zed builds a complete picture of your plant, and the opportunities in it, within hours.