
For water reuse facilities
Recover more, at lower cost,
with operations intelligence for every barrier.
Reuse trains have room to recover more for less. Pani finds where recovery and energy are lost, so you can safely push higher.
Recover
more
Zed finds the recovery you're leaving on the table, by train and by shift, so you can push it higher without guessing.
Cut cost
and energy
Zed tracks specific energy and chemical cost against recovery, so you see the trade-off directly, not in next quarter.
Hold your
compliance margin
Zed watches each barrier's margin as you optimize, so a recovery gain never quietly eats your compliance cushion.
Agent Zed
Your process analyst that never sleeps
Agent Zed is like your very own reuse expert that holds in its mind the entirety of your plant's data, operating history, and process control narrative. It can analyze, report, and advise around the clock.
Ask Zed
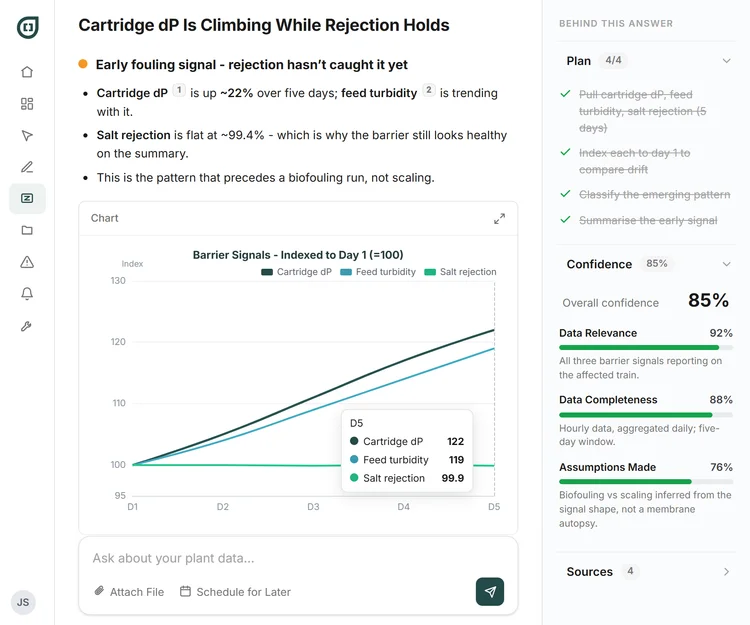
Ask Zed lets you put any question or analysis to Agent Zed and get an answer grounded in your own plant's data and history. At a reuse facility, that's a plain-language read on a barrier-integrity anomaly the moment it appears, without waiting for the next scheduled review.
Zed Jobs
Zed Jobs are recurring analyses you set up once and let Agent Zed run autonomously, on the schedule you choose. Here that means a continuous watch on UV dose and MBR barrier performance, and your management-review report assembled automatically from every barrier's data.
Just some of what Zed can do at a reuse facility
Zed can perform hundreds of jobs across the plant. Select from pre-built jobs or build your own for Zed!
Barriers
UV barrier divergence monitor
Watches UV intensity divergence and delivered dose, so a fading disinfection barrier is caught as it fades.
Barriers
MBR solids-barrier monitor
Watches the membrane-bioreactor solids barrier, so single-train operation stays within its limits.
Safety
Chemical-safety watchdog
Watches disinfectant-gas pathways and spill containment, a safety layer alongside the treatment one.
Compliance
Copper & lead margin
Watches regulated-metals compliance margin the same way the primary barriers are watched.
Reporting
Automated management review
Assembles your management-review report from every barrier's data, instead of compiling it by hand each cycle.
Membranes
UF permeability analysis
Analyzes ultrafiltration permeability, so a developing fouling issue is visible before it threatens the barrier.
Diagnostics
UF TMP root-cause
Traces a rise in transmembrane pressure to its root cause instead of just flagging the symptom.
CIP
Per-train CIP forecast
Forecasts each RO train's cleaning need, so CIPs are planned rather than reactive.
Membranes
RO train health analysis
Reviews each RO train's health, surfacing the one drifting before it drags recovery down.
Energy
Specific energy analysis
Breaks down specific energy use, so you can see where energy is overspent per unit recovered.
Recovery
Water loss analysis
Finds where water is being lost across the facility, so recovery gains have a target.
Instruments
I&C calibration tracker
Tracks instrument and control calibrations, so the data every barrier decision rests on stays trustworthy.
…and many others.
What Zed found at one facility
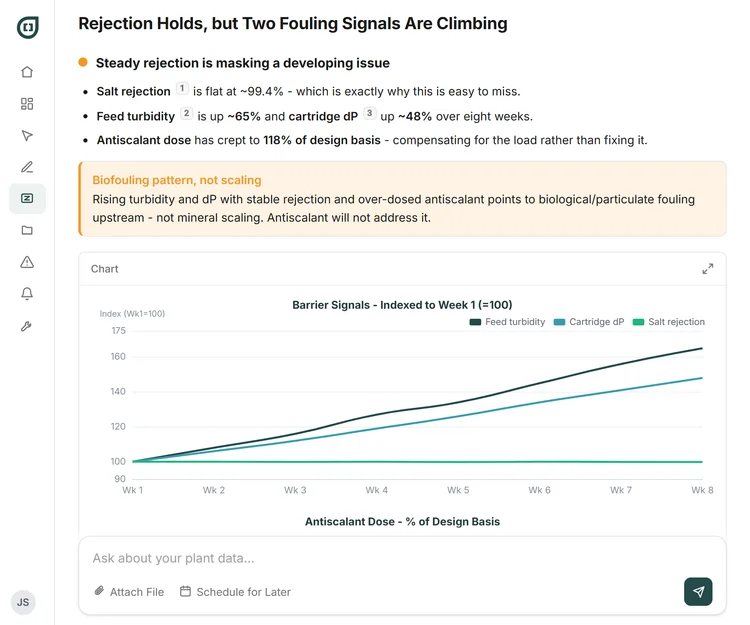
Feed turbidity and cartridge-filter differential pressure both climbed at one reuse facility while salt rejection held steady. Operators responded by raising antiscalant dose above the design basis, which masked the underlying fouling instead of reversing it.
At the same facility, a UV barrier was fading as its lamps and sleeves aged, eroding the disinfection barrier feeding a hospital campus's cooling towers and boilers. Zed caught it as it faded, not after it failed.
Data Explore
Trace it back to the cause
Explore lets you investigate any change or anomaly in your plant and follow it through every connected signal to the root cause. A dropping redox reading, for instance, isn't always a problem: Explore distinguished a real return-activated-sludge-flow failure on one train from an intended denitrification adjustment in the same signal.
Learn more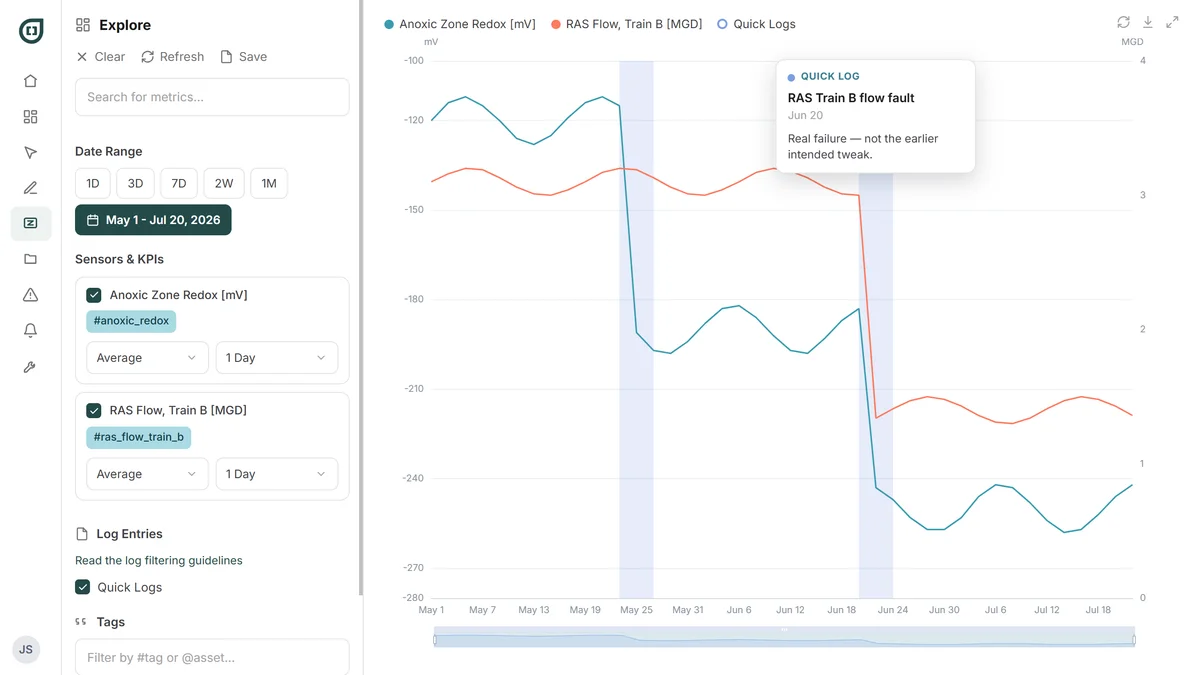
Advanced features & use cases
Dashboards & Reports
See the whole picture on one screen
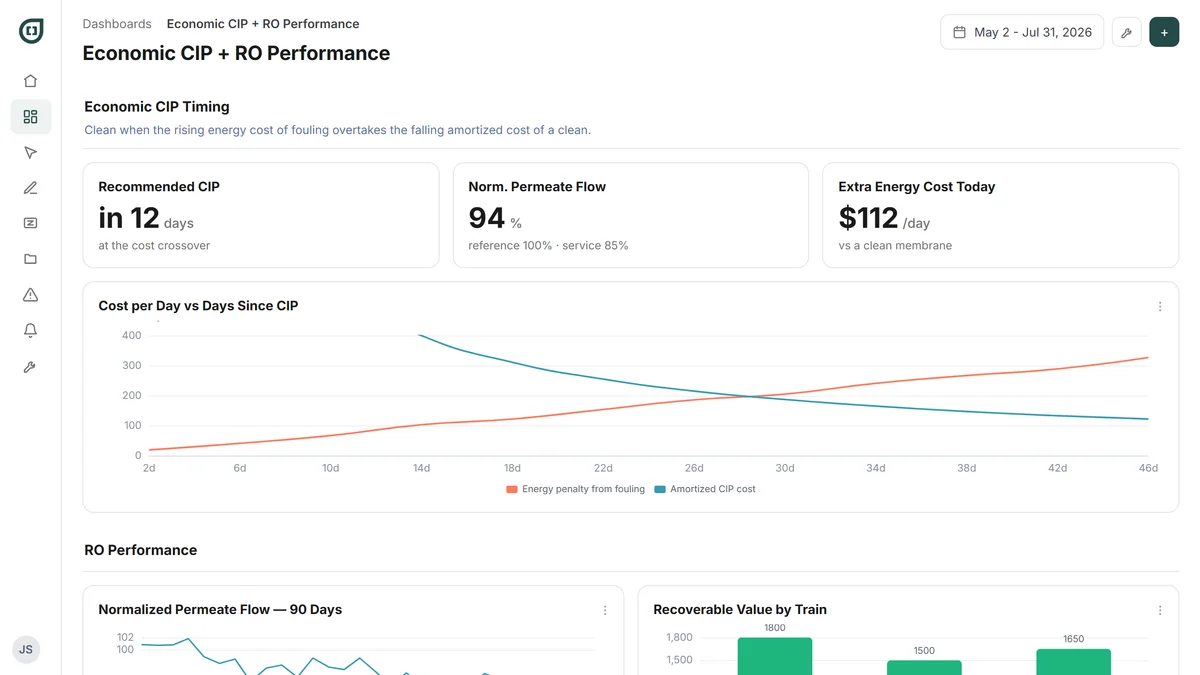
Dashboards bring every metric that matters into one live view, and reports package the summary for whoever needs it.
Alerts & Notifications
Go beyond basic alarms. Define alerts based on your own KPIs.
Pani watches your plant's signals around the clock and notifies the right person the moment something needs attention.
Chemical-safety and containment alerts
Disinfectant-gas handling and spill-containment monitoring, watched continuously, a safety layer that matters as much as the treatment one.
Regulated-metals compliance alerts
Copper, lead and other reuse-relevant metals, watched for compliance margin the same way the primary barriers are, not treated as an afterthought.
- Gas containment breachChlorine-room sensor> 1 ppm1.42m
- Regulated-metals marginCopper compliance> 0.9 × limit0.86×50m
- Lead trend to limitLead running trendProjected → limit34 dack
- Spill containmentSump level> high-highOK15m
- Disinfection residualChlorine residualWithin band1.2—
Chlorine gas above threshold
Chlorine-room sensor · 1.4 ppm
Clear the room and follow the gas-response procedure now.
Tasks & Procedures
Combine tasks with the right context to action them
Pani turns recurring work into assigned tasks with the right procedure attached, so the same job gets done the same way every time.
Barrier checks, validation routines, calibration schedules. Each one is created on the schedule you set, assigned, with a due date and the asset linked, so nothing that protects a barrier depends on memory.
Attach the procedure and the SOP is in front of whoever does the work. For a plant where every barrier has to be provable, that consistency is the point.
- UF-3 integrity testUF Rack 3To Do
- Chlorine contact logContact TankDone
- RO Train B CIPRO Train BIn Progress
- Anoxic zone DO checkAnoxic ZoneTo Do
- Barrier turbidity logBarrierDone
- Cartridge filter changeRO Train BTo Do
UF-3 integrity test
Vernius Reuse · Advanced treatment
AssetIsolate rack, run PDT; decay rate within barrier spec.
Fri, Aug 1
Want to go deeper?
Custom dashboards, trend-forecast alerts, calculated metrics your instruments don't report, and your procedures embedded in the work. Built for multi-barrier and multi-facility reuse operators, often utilities or O&M teams running several trains at once.
Case studies
A California groundwater replenishment system moved from calendar-based cleaning to cost-based cleaning, across 27 RO trains.
Deployed on 9 of 27 trains so far, with forecasting that flags a parameter before it crosses a critical threshold.
Read the storyAn industrial reuse plant found roughly 47 million liters a month leaving as flush water, with recovery sitting at about 49% against an achievable 51 to 53%.
Read the storyPut operations intelligence to work across every barrier
Upload the data you already have and Zed builds a complete picture of your plant, and the opportunities in it, within hours.